While August delivered relatively steady headline results, there’s more to the story beneath the surface. Subtle shifts in electricity demand, renewables contribution, and gas pricing dynamics are shaping procurement conditions across the country, and now is a good time to take stock.
Whether you’re on a fixed contract, reviewing your options, or navigating energy for the first time, our monthly wrap is here to help you make informed decisions with confidence.
Here’s what we’re seeing across electricity and gas markets, and why it matters.
⚡Electricity Market
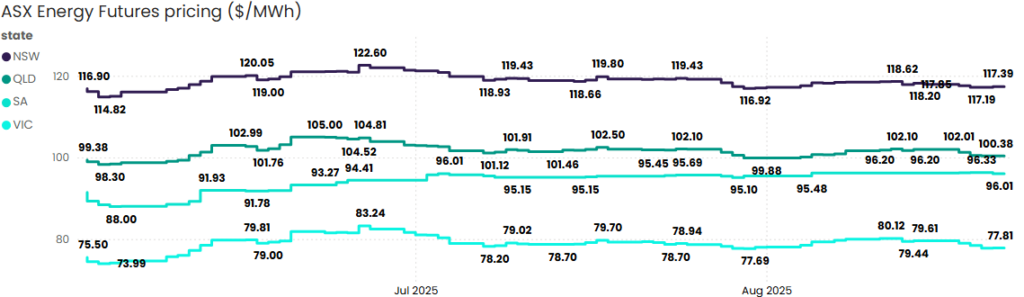
Source: ASX Energy Futures
Victoria
VIC futures dipped 0.2% to $77.81/MWh, but showed the highest price volatility of all NEM states, ranging from $77.75 to $80.12/MWh. Underlying demand declined 4%, while wind and solar performance supported grid conditions. Despite the dip, volatility remains a key consideration for Victorian businesses.
New South Wales
NSW futures edged up 0.4%, from $117.02/MWh to $117.39/MWh, trading in a narrow band that reflected relatively low volatility. Demand eased slightly, down 2% month-on-month, while the share of solar in the energy mix increased from 7.7% to 9.5%. Wind generation dipped slightly (13.8% → 10.7%), but overall renewable contributions helped moderate grid pressure.
Queensland
QLD futures rose 0.5%, closing at $100.38/MWh, with a slightly wider trading range (high of $102.10/MWh). Demand softened just 1%, while solar generation held steady at 9.3%, supporting system balance amid stable underlying fundamentals.
South Australia
SA futures also increased by 0.5%, reaching $96.01/MWh, but showed the lowest volatility across the NEM, prices stayed tightly within a $0.85/MWh range. However, demand dropped 7%, the largest decrease among states, pointing to weaker commercial and industrial activity. Solar rose from 5.0% to 7.2%, while wind slipped slightly (57.7% to 54.5%), still maintaining strong renewable coverage.
Tasmania
TAS pricing remained steady in August, with no major fluctuations in demand or generation. Hydro continued to underpin supply stability, but Tasmania remains sensitive to interconnector dynamics and broader volatility in mainland markets, particularly during periods of elevated NEM-wide demand.
Western Australia
In the SWIS (South West Interconnected System), winter demand increases were modest, and no significant price spikes were recorded. WA continues to operate independently of the NEM, with system resilience supported by a diversified generation mix and lower exposure to east coast supply constraints.
New Zealand
NZ electricity prices remained subdued across most regions in August, thanks to strong hydro inflows and mild seasonal conditions. South Island generation remained robust, while North Island demand remained within expected ranges. Overall, stability prevailed, though outlooks for Q4 will depend on rainfall patterns and reservoir levels.
🔥Gas Market
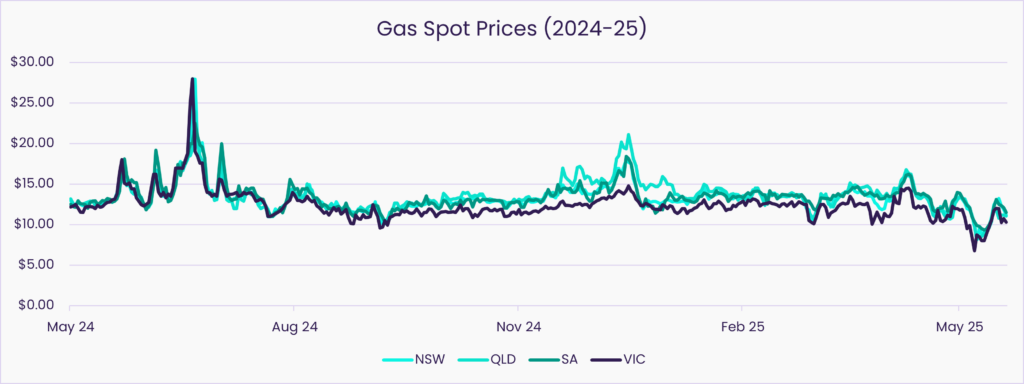
Source: AEMO STTM and DGWM Spot Market Data
Victoria
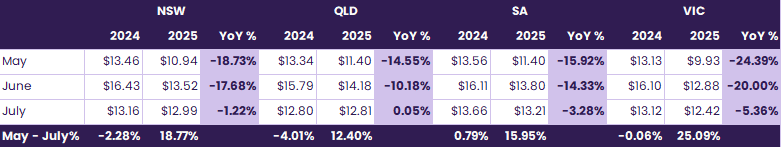
VIC gas prices eased 3.6% from $12.88/GJ in June to $12.42/GJ in July, reflecting softer temperatures and more stable supply. Prices remain 5.4% lower year-on-year, in line with the broader downward trend across east coast markets.
New South Wales
NSW prices dropped 3.9%, from $13.52/GJ to $12.99/GJ, following the cold snap in late June. July’s milder conditions helped moderate demand, though prices were only 1.2% below the same time last year, suggesting a more balanced winter overall.
Queensland
QLD recorded the largest decline, falling 9.7% from $14.18/GJ to $12.81/GJ. Year-on-year prices were virtually flat (+0.05%), highlighting Queensland’s relative stability compared to the southern states.
South Australia
SA gas prices dipped 4.3%, from $13.80/GJ to $13.21/GJ, supported by more consistent renewables output and fewer system stress events. Prices are still 3.3% lower YoY, reflecting improved supply resilience and milder weather.
LNG Netback
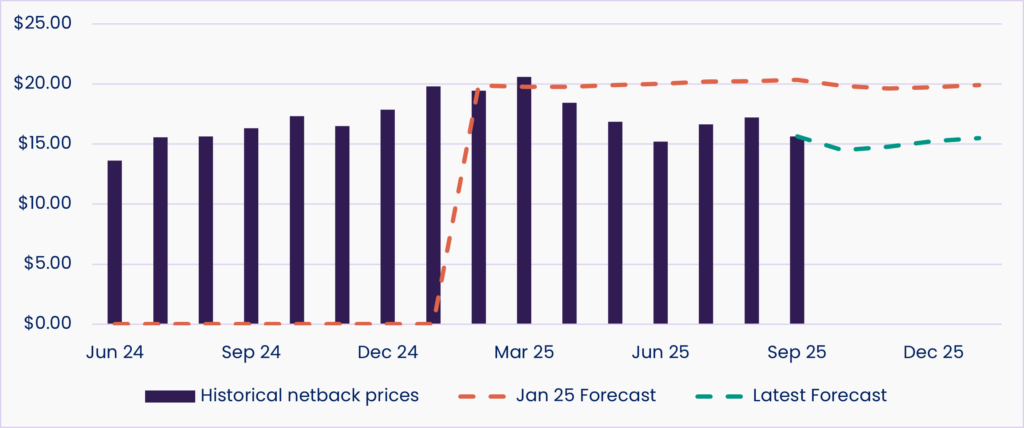
Netback prices continued their recovery in August, lifting from $16.64/GJ in July to $17.23/GJ, reversing some of the earlier softening observed in Q2. While the January 2025 forecast expected Q3–Q4 prices to remain above $20/GJ, the latest outlook has been revised downward slightly.
North West Shelf LNG Plant Gets Approval to 2070
The Woodside operated North West Shelf LNG plant has secured approval to keep running until 2070, under strict new environmental conditions. These include a 60% reduction in nitrogen oxide emissions by 2030 and 90% by 2061. The approval secures decades of continued gas exports out of WA, while intensifying scrutiny over the project’s environmental footprint and cultural heritage impacts.
What does this mean for you?
- For gas buyers: long term supply certainty is reinforced.
- For investors: environmental and compliance risk is higher and needs monitoring.
- For corporates: long lived fossil fuel assets remain part of the mix, with implications for net zero strategies.
Electrification & Efficiency Could Deliver 20% of Cuts
New analysis from the Energy Efficiency Council shows that electrification and energy efficiency measures could deliver around 20% of the emissions reductions needed for Australia to meet its 2035 target of a 75% cut. The findings highlight opportunities across homes, commercial buildings and industry.
What does this mean for you?
- For energy buyers: incentives and policy focus are shifting toward demand side measures that can lower costs.
- For operations teams: electrification will change when and how you use energy, with higher peaks to manage.
- For businesses: efficiency and electrification projects can strengthen compliance positions while improving the bottom line.
ESOO Flags Reliability Risks Beyond 2028
AEMO’s 2025 Electricity Statement of Opportunities (ESOO) warns of reliability risks emerging beyond 2028 as coal plants retire faster than new capacity can replace them. The report highlights that while rooftop solar and large scale renewables are growing, the system still depends heavily on firming capacity from gas, batteries and interconnectors. Investment timing and regulatory approvals will determine whether the grid can manage the transition without shortfalls (AEMO)
What does this mean for you?
- For large energy users: reliability risks flagged by AEMO could translate into price volatility and shifts in contract value.
- For businesses considering new projects: assets that add firming capacity are likely to attract stronger market and policy support.
- For corporate buyers: long term contracting strategies should account for the supply gaps highlighted by AEMO.
Ready for what’s next?
As your energy partner, Utilizer is here to help you cut through the noise and make confident decisions. Reach out today and let’s talk.
More power to you.